Tuesday, November 27, 2018

econlife - The Cash We Love to Stash by Elaine Schwartz


Each year, the Federal Reserve decides how much cash to print. The new bills are primarily used to replace whatever is too tattered or worn out. Meanwhile, the old ones are withdrawn from circulation.

Below you can see the Fed’s 2018 print order. Only the $20s exceed the new $100s they are creating this year:


Why We Want $100 Bills

The $100 bill just became the most popular kind of cash. For years, the dollar was in the lead. No longer:


For many reasons, a $100 bill is a handy denomination. Because of the financial crisis and low interest rates, people have more cash. It makes sense that whatever cash we stash under the mattress is in large bills.

Similarly, $100 bills are the note of choice for the “informal,” underground economy. Explained in a Harvard Business School paper, they are universally acceptable, they retain their value, and they are easily transportable. Add anonymity to that list and you get the perfect currency for illegal transactions. Similarly, the $100 bill is ideal for people in countries with unstable currencies.

It is also easy to ship $100 bills. In 2012, The Atlantic said we send pallets, each with 640,000 $100 bills, to destinations outside the U.S. Because financial intermediaries pay for those bills–called seignorage–we make money when we “export” them.

Finally, you might be thinking that we live in a digital age. However, people do want to continue using cash–more so in some places than others:


Our Bottom Line: What is Money?


Small rectangles made of cotton and linen, sea shells, or massive stone disks are considered money if they have three characteristics:


  • A medium of exchange: People accept it as payment.
  • A unit of value: People know what it’s worth.
  • A store of value: Its purchasing power is relatively stable over time.

Like the $100 bill, these huge limestone disks on the Micronesia island of Yap have also functioned as money.


My sources and more: Quartz reminded me it was to look again at the $100 bill and at who uses cash. From there, you might want to see the Fed’s money order and more about the Yap. But returning to the $100 bill, The Atlantic and this HBS paper had the detail.

Ideal for the classroom, econlife.com reflects Elaine Schwartz’s work as a teacher and a writer. As a teacher at the Kent Place School in Summit, NJ, she’s been an Endowed Chair in Economics and chaired the history department. She’s developed curricula, was a featured teacher in the Annenberg/CPB video project “The Economics Classroom,” and has written several books including Econ 101 ½ (Avon Books/Harper Collins). You can get econlife on a daily basis! Head to econlife.

Thursday, November 15, 2018

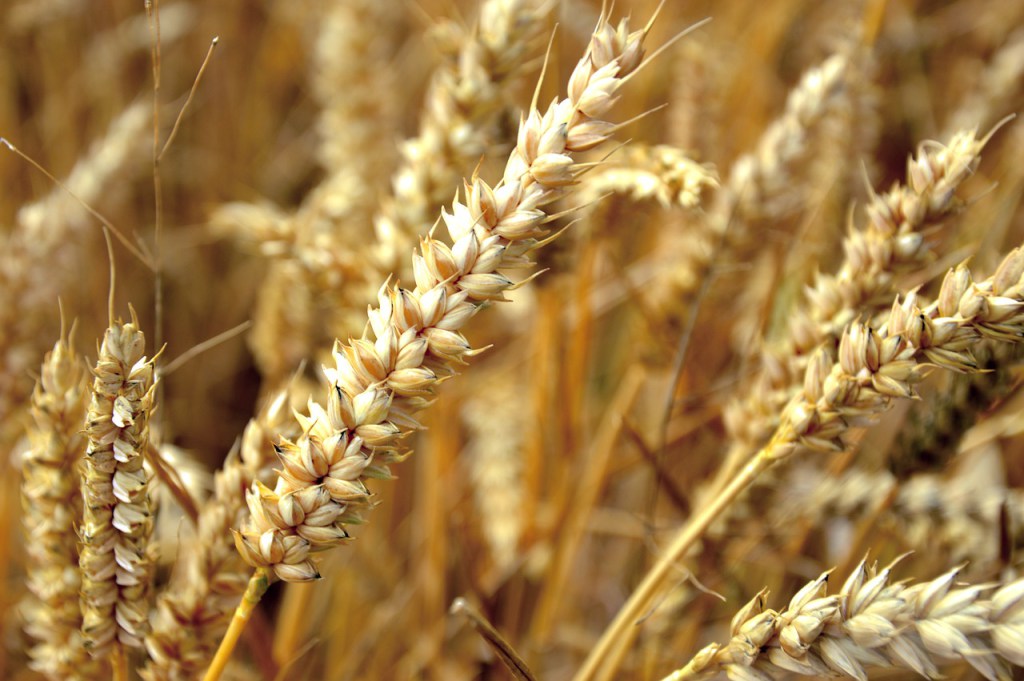
econlife - A Russian Wheat Story With an Unexpected Ending by Elaine Schwartz


There once was a farmer who started to accumulate land in 2005 and now has 3,600 acres. While at first he planted wheat with a dilapidated tractor, now he has state-of-the-art John Deere equipment, top notch fertilizer, and up-to-date seeds.

Sounds like Iowa?

No, this wheat farmer is in Russia. His land is in the same place that Soviet collective farms called Lenin’s Path and Dawn of Communism had once underproduced. But this gentleman sounds like an entrepreneur. He works long hours, owns a fleet of trucks, benefits from a cheap ruble, and has access to improving storage facilities. In world markets he has been faring beautifully.

Russia just pulled ahead of the U.S. as the world’s biggest wheat producer:


Reading about this farmer in a recent WSJ article, I couldn’t help but think about how the Russian economy has changed.

Our Bottom Line: Economic Systems

We could say there are three basic economic systems. And Russia had all of them during the past 120 years.

Tradition

Looking way back at some Russian history, we could go to a typical pre-revolutionary estate owned by an exceedingly affluent family called Osorgin. Located 90 miles south of Moscow, their manor had eight villages, 8,327 acres, and 600 serfs. Its agricultural life was dominated by tradition. In traditional systems, land, labor, and capital produce the same goods and services year after year. Because roles are passed down from father to son and mother to daughter, all remains pretty much the same.

Command

Leaping to the 1920s, we have the Bolsheviks seizing farmland and the beginnings of a command economy. Through a series of five-year plans, the Soviets form a central planning apparatus that told people what and how to produce. As for agriculture, they created a network of collective farms where employees worked for a daily wage determined by economic planners. Individual initiative was disparaged and innovation was unnecessary. While Russia had been a major exporter of wheat until 1913, by the 1970s, they were unable to feed their entire population.

The Market

It took until 1991 for it all to collapse. With privatization, we get some capitalism and a wheat farmer who buys land, works hard, and flourishes. He employs ten farmhands, a cook and 3 guards.


Perhaps this entrepreneur is an unexpected ending to our 120-year Russian wheat story.

My sources and more: A WSJ front page article alerted me to Russian wheat. It also returned me to all that is fascinating about Russian history. I tell some of the story in my text, Understanding Our American Economy–available through econlife.


Ideal for the classroom, econlife.com reflects Elaine Schwartz’s work as a teacher and a writer. As a teacher at the Kent Place School in Summit, NJ, she’s been an Endowed Chair in Economics and chaired the history department. She’s developed curricula, was a featured teacher in the Annenberg/CPB video project “The Economics Classroom,” and has written several books including Econ 101 ½ (Avon Books/Harper Collins). You can get econlife on a daily basis! Head to econlife.

Wednesday, November 14, 2018

Student-led Conferences by Mike Siekkinen

This year, my team tried a new approach to doing parent-teacher conferences. We let the student lead the conferences.

As teachers know, a typical parent-teacher conference is called by a parent or by the teachers to discuss student behavior/achievement/effort/etc. The purpose of the conference is still the same, but with student led conferences, the method changes.

Once a conference is scheduled, we provided students with a script (outline) of questions they were required to prepare for prior to the conference. Students would introduce themselves and then discuss their grades, behaviors, strengths and weaknesses. Parents would hear this from their child verses from a teacher. This also allowed students to “own” their behaviors.

We would sit back and respond when questioned or add to student’s discussion. We found that students were generally very honest in answering the questions. We also found that, especially when student performance was the issue, hearing directly from their child had much more of an impact on parents and was much less confrontational between parents and teachers. With this we also came up with a plan on how to proceed from there to help the student.

We came up with an initial script and then fine-tuned it as the year went on. This could easily be adapted to younger children up through high school. I am an eighth grade teacher and this method served us well this year. Give it a try for next school year. I think you will see the positive changes that occur.


mike_s_blogDr. Mike Siekkinen, a retired U.S. Navy submariner, became a teacher as a second career. He teaches history at St Marys Middle School as well as Adult and Career Education at Valdosta State in Georgia.

Tuesday, November 6, 2018

econlife - Looking For Peak Creativity by Elaine Schwartz


The average Nobel laureate received his award at 59.7 years. (Sadly, yes it is his award. 847 went to men; 51 to women from 1901-2017.). So his most creative years must have been before then? Probably but not necessarily.

Peak Scientific Creativity

It is possible that our leading scientists peak near 40. The reason could be the time it takes to learn what you need to know:


People in the arts also seem to have that early midlife peak. One researcher said it was when you’ve lived 62% of your life:


However, in addition to age, there are other ways to slice the data. There is a divide between discoveries that are more or less abstract. The abstract breakthroughs come at an earlier age, perhaps because more experience is necessary for the “experimentalists.” The data comparing the two, below, came from Nobel laureates:


We can also use time to assess our facts. Then we would find we are getting older. Comparing the beginning and end of the 20th century, we have to add six years to the average age of a distinctive achievement:


Our Bottom Line: Human Capital Investment

Our common threat here is human capital. Whether looking at science or the arts, at Albert Einstein at 26 or Clint Eastwood at 84, we have people who are adding to their store of learning. And when they do, they have increased their human capital.

A second thread is a host of questions. The researchers really do not agree. The fact that the young are most creative has been challenged as well as peak creativity data for each discipline. And we have a host of other variables to consider that include funding, institutional biases and family responsibilities.

I even would ask if we have to judge peak creativity as we do business cycle data. We can never be sure until the (life) cycle ends. So too with all of us.

Let’s just conclude by saying we have young geniuses and old masters…and all of us might still look forward to our creative peak…or we could figure out if we are at that 62% point.


My sources and more: For the data and the disagreement, I recommend this 2016 paper this one that disagrees, and this article. However, if you just want a good read, the Washington Post Wonkblog had it.


Ideal for the classroom, econlife.com reflects Elaine Schwartz’s work as a teacher and a writer. As a teacher at the Kent Place School in Summit, NJ, she’s been an Endowed Chair in Economics and chaired the history department. She’s developed curricula, was a featured teacher in the Annenberg/CPB video project “The Economics Classroom,” and has written several books including Econ 101 ½ (Avon Books/Harper Collins). You can get econlife on a daily basis! Head to econlife.

Thursday, November 1, 2018

econlife - The Facts You Never Knew About the Nobel Economics Prize by Elaine Schwartz


Yes, Paul Romer and William Nordhaus just won the 2018 Nobel Economics Prize. But it is not quite the same as the other Nobel awards.

Today, some facts that we rarely hear about Nobel Prize winners.

The Prize

Alfred Nobel never endowed a Nobel Prize in economics. More than 70 years after the original Nobels were created, Sweden’s Central Bank commemorated its 300th anniversary with a fund that established The Sveriges Riksbank Prize in Economic Sciences in Memory of Alfred Nobel. Although it is managed just like the other Nobel Prizes, the money instead comes from the Bank. In 1969, Jan Tinbergen and Ragnar Frish were the first recipients.

A Call From Adam Smith

Rather remarkably, the former editor-in-chief of nobelprize.org was Adam Smith. As the person who notified the winners in an early morning call, he sometimes had to let them know he was for real.

Excerpt from the 2006 call to Edmund Phelps:


A Divorce Settlement
Nobel Laureate Robert Lucas’s former wife perfectly timed her divorce settlement. She included a clause that said she got half of any Nobel Prize he received before October 31, 1995. Because he won the 1995 Economic Prize during October, it was just in the nick of time for her to get $500,000.

A Parking Space

If you teach at Duke and win a Nobel Prize, you get a parking space. The school decided that anyone who is honored by so auspicious an award deserves a spot right outside his or her office. Similarly, Brown, USC, and Northwestern offer the same perk,

The sign at USC:


Our Bottom Line: The Margin

As economists, we can always say we are thinking at the margin. Defined as the line where something extra starts, the margin is where more was added to Nobel Prizes.

But this year, probably not a parking space. It appears that neither Yale (Dr. Nordhaus) nor NYU (Dr. Romer) offer parking spaces to their Nobel Laureates.

My sources and more: For Nobel “trivia,” I thank WSJ for yesterday’s article on the parking spots. From there I recommend this Brookings report with other unknown Nobel facts.

Ideal for the classroom, econlife.com reflects Elaine Schwartz’s work as a teacher and a writer. As a teacher at the Kent Place School in Summit, NJ, she’s been an Endowed Chair in Economics and chaired the history department. She’s developed curricula, was a featured teacher in the Annenberg/CPB video project “The Economics Classroom,” and has written several books including Econ 101 ½ (Avon Books/Harper Collins). You can get econlife on a daily basis! Head to econlife.


Tuesday, October 23, 2018

econlife - The Problem With Emissions Outsourcing by Elaine Schwartz


When California’s Bay Bridge was built in 2011, the uproar was about jobs. U.S. steelworkers protested when sections of the bridge as big as half a football field were made in China and then shipped to the U.S. They said the bridge should have been made here.

Below you can (almost) see workers welding a section of the Bay Bridge in Shanghai: 

Bridge_Comes_to_San_Francisco__With_Made-in-China_Label_-_The_New_York_Times

Now the protests have changed.


Outsourcing Emissions


The Buy Clean California Act requires state agencies and universities to consider greenhouse gas emissions when selecting firms for public works projects.  Called “global warming potential,” the emissions created from fabricating certain types of steel, glass, and wool board will be required in the bidding process. Enforcement starts during 2019, after lawmakers have quantified their criteria.

A California congressmen explained that he proposed the law “to support clean manufacturing.” He might have added “everywhere” to the end of his sentence. After all, the Bay Bridge used steel from a heavy polluter in China. So buying steel from them increased “global warming potential.”

The goal is to limit this emissions outsourcing. Called a carbon “loophole,” (mostly) developed countries are sidestepping their emissions admissions. The California law makes them responsible for what other nations emit. A new paper calls it “embodied emissions” in globally traded goods.

Recognizing the surprising proportion of emissions in traded goods could help us reduce them:

Lovesf_-_The_Carbon_Loophole_in_Climate_Policy_copy

These are the carbon emissions importing and exporting nations:


Lovesf_-_The_Carbon_Loophole_in_Climate_Policy_copy-1


Our Bottom Line: Negative Externalities


Polluters create a negative externality. If there is no penalty, they incur no cost for the harm they impose on the environment. Instead, uninvolved third parties experience the illnesses their emissions create.

To graph the problem, an economist would draw a supply curve that should shift to the left:

Negative-Externality

British economist Arthur Pigou (1877-1959), proposed that a tax be levied on a good or service that creates a negative externality. California has a different solution. Still though, they too create less supply.

My sources and more: You might find it fascinating (as did I) to compare the 2011 NY Times article on the Bay Bridge with this one. Then, if you want to read some analysis, do look at this paper on outsourcing emissions. And finally, for more legislative insight, here is the goal of the California law and its content.


Ideal for the classroom, econlife.com reflects Elaine Schwartz’s work as a teacher and a writer. As a teacher at the Kent Place School in Summit, NJ, she’s been an Endowed Chair in Economics and chaired the history department. She’s developed curricula, was a featured teacher in the Annenberg/CPB video project “The Economics Classroom,” and has written several books including Econ 101 ½ (Avon Books/Harper Collins). You can get econlife on a daily basis! Head to econlife.

Thursday, October 18, 2018

econlife - (Mc)Wages Around the U.S. by Elaine Schwartz


At 162 million (or so), the U.S. labor force is large and diverse. So, when we say that wages are 2.9% higher than last August, it sounds simple. But it really is not.

Where you live can determine what you earn.


McWages


It’s tough to compare wages around the United States. Yes, lots of people could be called auto workers or potato and computer chip makers. However, depending on the region, we would find that similar sounding jobs can be rather different.

But not for McDonald’s.

Looking at McDonald’s “basic crew” employees, we can compare “apples to apples.”  At a Hamburger University campus, you can get a similar education. And, at your local McDonald’s, no matter where, you follow the same operations manual. Or as Princeton professor Orley Ashenfelter and his co-author Å tÄ›pán Jurajda explained, you have “standardized capital.”

Wages

Because those McDonald’s jobs are so similar, we can get a more accurate picture of wage differences. In 2016, 29 states and 41 cities deviated from the federal hourly minimum of $7.25. Ohio had a minimum wage of $8.10 then (now it’s $8.15) while Pennsylvania was at the federal minimum (and still is) for its privately employed work force. The impact on the McWage was evident. In Ohio, it was $8.35 and Pennsylvania, $7.81.

Similarly, across the nation, people’s McWage rates differ for almost identical work. In the following map, the darkest blue areas take us between $8.75 and 13.00 an hour while the next lighter blue is $8.05-$8.75. At the bottom, in very light blue and almost white, we go from an hourly wage of $8.05-$7.50 to $7.50-$7.25:

newtheoremtheoremTheorem-1

Purchasing Power

Correspondingly,  McDonald’s workers’ purchasing power is not the same. With one hour of wages, an Ohio employee can buy 2.05 Big Macs while a Pennsylvania employee could get 1.81. But for the highest purchasing power, we have to go to Nebraska, Minnesota, and North Dakota where one hour of work gets them 2.3 Big Macs. At the other end are Maine and Louisiana where workers can buy approximately 1.7.

newtheoremtheoremTheorem-2

As for Big Mac prices, there is a whopper of a difference. Big Macs varied in 2016 from a (median) high of $8.36 down to $2.76.

newtheoremtheoremTheorem-3


Our Bottom Line: The Zigzags in the British Coastline


The authors of the Princeton paper point out that much of our labor force information is from surveys that are general. While they let us compare workers with a similar education and occupation, they don’t convey the massive differences among these workers.

Instead, because the Princeton paper looks more closely at the McWage worker, it can show us (for example) the “negative employment impact of Chinese imports.” Their point is that a close look not only unveils a correlation but also the potential for greater insight. If we know precisely who is affected by changes in trade, we can design programs that target them.

So, while our focus has been McDonald’s basic crew employees, we are really talking about an immensely varied labor force. When the Labor Department tells us that wages have increased by 2.9% ($.77) during the past year, they are referring to a current national hourly average of $27.16. But you can see that the average, while important, can obscure a much more complex situation.

In the same way, Benoit Mandelbrot, the father of fractal geometry, told us that the closer you look at Great Britain’s coastline the more you see. From a distance, it is a curved line. However, looking closely, we see countless indents and zigzags.

So too with the U.S. labor force.

My sources and more: While reading the McWage paper was a slog, its ideas were fascinating. Similarly, for a firsthand look at the statistics, the August employment report had the wage data and a link to wages in different industries. The one article I recommend is from CNBC about why fast food workers in North Dakota “bring home the Bakken.” It conveys ideally why McDonald’s pays a high wage rate there.

Please note that this post was slightly edited after publication to improve clarity.


Ideal for the classroom, econlife.com reflects Elaine Schwartz’s work as a teacher and a writer. As a teacher at the Kent Place School in Summit, NJ, she’s been an Endowed Chair in Economics and chaired the history department. She’s developed curricula, was a featured teacher in the Annenberg/CPB video project “The Economics Classroom,” and has written several books including Econ 101 ½ (Avon Books/Harper Collins). You can get econlife on a daily basis! Head to econlife.

econlife - Who Will Sacrifice Civil Liberties During a Pandemic? by Elaine Schwartz

  In a new NBER paper, a group of Harvard and Stanford scholars investigated how much of our civil liberties we would trade for better heal...